
Organizational Network Analysis:
Visualizing how organizational change impacts collaboration

Why?
Line of Business (LOB) leaders lacked a direct line of sight into the repercussions change has on collaboration within their organization.
“How has the re-org affected collaboration and communication across my organization?” is an example of a common question posed to analysts by LOB leaders.
In Microsoft’s Viva Insights product, we created ONA (Organization Network Analysis) to leverage metrics from Office 365 and Teams to visualize and quantify changes in collaboration patterns before/after a change event transpired.

Outcomes
- Delivered new, unique value to analysts, leaders, HR, and more
- Increased premium seats for the Viva Insights product
- Enabled our customers’ analysts and admins to show the value and ROI and make the case for more premium seats
- Developed meaningful, collaboration-enhancing processes and operations between design and product, engineering, sales, and more
We have apples-to-oranges, and need apples-to-apples
Structural changes to organizations are fundamental. How, then, can you compare the impact on collaboration when the structure before and after the change is so different?
Careful and deliberate collaboration with engineering, including ideation and breaking-down scenarios, ensured we understood and addressed the challenges our users and backend systems would encounter.
Artifact | Diagrams created for engineering to help tackle the problem an organization radically altering structure after a change, and how we could still offer a users an apples-to-apples comparison when looking at impact on collaboration, etc.
Solution
ONA enables our customers to visually, qualitatively, and quantitatively...

Diagnose organizational network issues and potential

Analyze the impact an organizational change and increase the scope, revert a change, or reconsider a change.

Better determine, along with other metrics & measures, the ROI of investments in a change
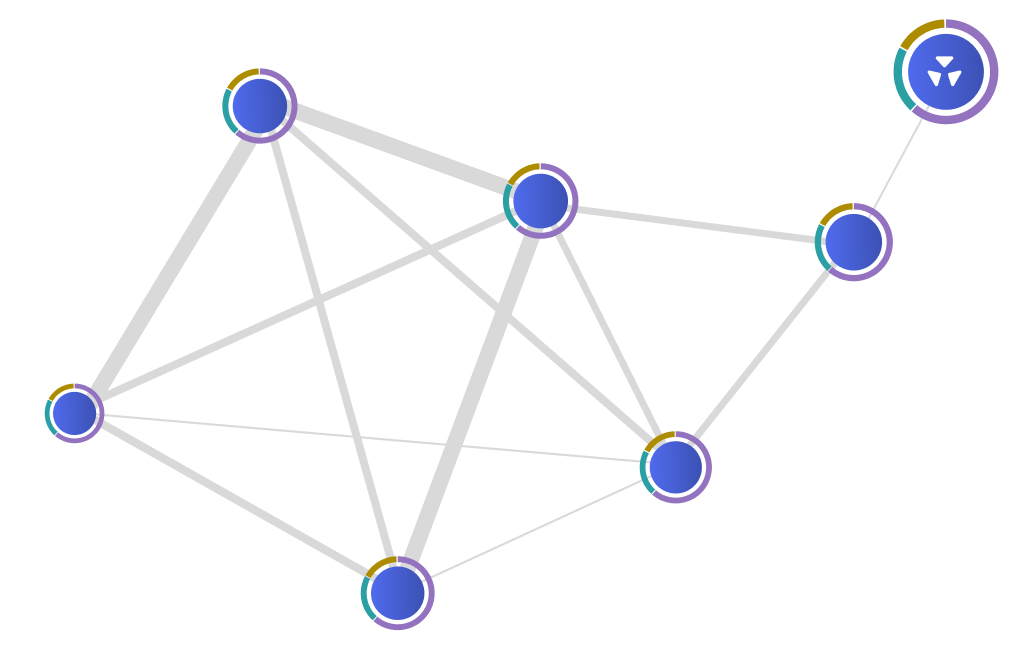
A quick glimpse into a few of the UI views powering the experience
Organizational Network Analysis:
Visualizing how organizational change impacts collaboration
Why?
Line of Business (LOB) leaders lacked a direct line of sight into the repercussions change has on collaboration within their organization.
“How has the re-org affected collaboration and communication across my organization?” is an example of a common question posed to analysts by LOB leaders.
In Microsoft’s Viva Insights product, we created ONA (Organization Network Analysis) to leverage metrics from Office 365 and Teams to visualize and quantify changes in collaboration patterns before/after a change event transpired.
Outcomes
- Delivered new, unique value to analysts, leaders, HR, and more
- Incr eased premium seats for the Viva Insights product
- Enabled our customers’ analysts and admins to show the value and ROI and make the case for more premium seats
- Developed meaningful, collaboration-enhancing processes and operations between design and product, engineering, sales, and more
We have apples-to-oranges, and need apples-to-apples
Structural changes to organizations are fundamental. How, then, can you compare the impact on collaboration when the structure before and after the change is so different?
Careful and deliberate collaboration with engineering, including ideation and breaking-down scenarios, ensured we understood and addressed the challenges our users and backend systems would encounter.
Artifact | Diagrams created for engineering to help tackle the problem an organization radically altering structure after a change, and how we could still offer a users an apples-to-apples comparison when looking at impact on collaboration, etc.
Solution
ONA enables our customers to visually, qualitatively, and quantitatively...
Diagnose organizational network issues and potential
Analyze the impact an organizational change and increase the scope, revert a change, or reconsider a change.
Better determine, along with other metrics & measures, the ROI of investments in a change
A quick glimpse into a few of the UI views powering the experience

Organizational Network Analysis:
Visualizing how organizational change impacts collaboration
Why?
Line of Business (LOB) leaders lacked a direct line of sight into the repercussions change has on collaboration within their organization.
“How has the re-org affected collaboration and communication across my organization?” is an example of a common question posed to analysts by LOB leaders.
In Microsoft’s Viva Insights product, we created ONA (Organization Network Analysis) to leverage metrics from Office 365 and Teams to visualize and quantify changes in collaboration patterns before/after a change event transpired.
Outcomes
- Increased premium seats for the Viva Insights product
- Delivered new, unique value to analysts, leaders, HR, and more
- Enabled our customers’ analysts and admins to show the value and ROI and make the case for more premium seats
- Developed meaningful, collaboration-enhancing processes and operations between design and product, engineering, sales, and more
We have apples-to-oranges, and need apples-to-apples
Structural changes to organizations are fundamental. How, then, can you compare the impact on collaboration when the structure before and after the change is so different?
Careful and deliberate collaboration with engineering, including ideation and breaking-down scenarios, ensured we understood and addressed the challenges our users and backend systems would encounter.
Artifact | Diagrams created for engineering to help tackle the problem an organization radically altering structure after a change, and how we could still offer a users an apples-to-apples comparison when looking at impact on collaboration, etc.
Constant validating with customers
From interviews to testing, consistent validation with customers ensured we remained on-target to deliver valuable, elegant solutions to critical needs.
Measuring how our beta product solved critical customer needs
Solution
ONA enables our customers to visually, qualitatively, and quantiatively
Diagnose organizational network issues and potential
Analyze the impact an organizational change and increase the scope, revert a change, or reconsider a change.
Better determine, along with other metrics & measures, the ROI of investments in a change
A quick glimpse into a few of the UI views powering the experience